A bug


It appears that both versions of the tool have a bug in the default conversions defined in NativeMappings.hs

They got introduced in a major restructuring that took place before 4.8 and slipped through my regression tests.

I’ll upload a fixed version as soon as possible.

Sorry for any inconvenience

Update: Version 0.5.1 fixes the bug mentioned.

Some more details: originally all my convertion functions were pure, the problem is, some activities like creating a pointer required IO. This is why currently everything is done in IO. When I converted the library I missed some calls, and those calls were giving an error now saying that the convertion function was undefined.

Tracing Lexer memory leaks


One of the problems I’ve been struggling with for a while now is the presence of pesky memory leaks in Visual Haskell. Hs2lib has one convention, It doesn’t free any memory, and so you’re responsible for freeing all memory.

As far as I knew, I was freeing any and all pointers that I had. It should not be leaking, but yet it was. So I decided to get to the root of this problem. I wrote a simple application that uses the Lexer classes of Visual Haskell and would emulate a user scrolling by feeding it lines of a Haskell file one at a time.

Using the Debug Diagnostics Tools I was able to track the application and make a full memory dump every few seconds in order to track the progression of the leak. The results were rather surprising:

WARNING – DebugDiag was not able to locate debug symbols for HsLexer.dll, so the reported function name(s) may not be accurate.

HsLexer.dll is responsible for 11.95 MBytes worth of outstanding allocations. The following are the top 2 memory consuming functions:

HsLexer!HsEnd+1343ac4: 8.20 MBytes worth of outstanding allocations.

HsLexer!HsEnd+150ae89: 2.00 MBytes worth of outstanding allocations.

This was detected in LexerLeakTest.exe__PID__4660__Date__07_04_2011__Time_03_20_30PM__18__Leak Dump – Private Bytes.dmp

So according to this tool, my little program was leaking quite extensively and not surprisingly, it was all coming from my inside my Haskell program. Unfortunately, GHC/GCC can not produce the proper symbols (.pdb files) for any of the Microsoft debugging tools to understand. So while we know conclusively that the program is leaking, we don’t know where.

Hs2lib-Debug

This is where the new version of Hs2lib comes into play. The idea is to track any and all allocations and de-allocations made during the run of the program, in essence a simple profiler.

For this reason we now have Debug versions of the of modules. Through the magic of CPPHS, Cabal and custom preprocessors we get the usual “release” modules and “debug” modules which write the allocations to a file.

I’ll skip over the implementation of that, but the idea is to override all allocation functions with a custom one. The structure which is being written out to disk (the current version uses the rather slow show/read instances generated by GHC. I will be replacing these in the future) is:

<br />
data MemAlloc = MemAlloc { memFun   :: Caller<br />
                         , memStack :: Stack<br />
                         , memStart :: Address<br />
                         , memStop  :: Maybe Address<br />
                         , memSize  :: Maybe MemSize<br />
                         , memTime  :: String<br />
                         }<br />
              | MemFree { memStack :: Stack<br />
                        , memStart :: Address<br />
                        , memSize  :: Maybe MemSize<br />
                        , memTime  :: String<br />
                        }<br />
              deriving (Show, Read)<br />

The allocations get written out to a file called “Memory.dump”.

A piece of one such file is:

<br />
MemAlloc { memFun = Record<br />
         , memStack = Then "WinDll\\Lib\\/NativeMapping_Base.cpphs:242(peekCWString)"<br />
                     (Then "HsLexer.hs:85(fromNative)"<br />
                     (Then "HsLexer.hs:83(lexSourceStringWithExtA)"<br />
                      Empty))<br />
         , memStart = 43309024<br />
         , memStop = Just 43309026<br />
         , memSize = Just 2<br />
         , memTime = "1312779866"<br />
         }<br />
MemFree { memStack = Then "WinDll\\Lib\\/NativeMapping_Base.cpphs:246(freeCWString)"<br />
                    (Then "HsLexer.hs:85(fromNative)"<br />
                    (Then "HsLexer.hs:83(lexSourceStringWithExtA)"<br />
                     Empty))<br />
        , memStart = 43309024<br />
        , memSize = Just 2<br />
        , memTime = "1312779866"<br />
        }<br />

From this you can see that not only does it record allocation, but I’ve also implemented a simple artificial stack, that shows us where the allocation is/originated. The current implementation is rather simplistic. I will look into expanding this later, but for now it suits my needs.

For those wondering, this tracker is not enabled by default. To enable it just pass the “- -debug” flag to the call to Hs2lib. Compiling with this flag instructs the library to use the Debug version of the libraries, and changes the code generators so that they also add extra information to the generated code.

Since de-allocations also have to be tracked, using this flag also exposes a free function which should be used to free pointers. If the CallingConvention  used is stdcall then a function “freeS” is exported, if ccall then “freeC” is exported. The reason for this is because these functions are statically defined. They aren’t being generated by the tool but are instead part of the library part of the tool.

Performing analysis

Once we have a .dump file, the next step is to analyze this information. This is where the new tool Hs2lib-debug comes in. This tool replays the allocations in a pseudo heap. If all goes well, at the end the heap should be empty. If it has any entries it means we’ have a leak.

Invoking it is quite easy, just pass it as an argument the folder which contains the dump file:

Hs2lib-debug.exe -v .\MemDumps

and that’s all.

Running this on the dump file created from the lexer program returned:

*** Program starting up…

*** Reading file ‘.\MemDumps\Memory.dump’…

*** Found 31890 record(s).

*** Analyzing [********************] 100.00%

*** Found 1135 outstanding allocation(s).

1135 unfreed references found originating from HsLexer.hs:85(fromNative)\;\;\WinDll\Lib\/NativeMapping_Base.cpphs:242(peekCWString)\;

*** Cleaning up….

Done.

The messy output for the stack is a as follows: Entries in the path are separated by a ;, instead of the usual \ character.

The function the profiler pointed out is:

<br />
lexSourceStringWithExtA :: StablePtr (IORef [ExtensionFlag]) -&gt; CWString -&gt; IO ((StatelessParseResultPtr (Located Token)))<br />
lexSourceStringWithExtA a1 a2 =<br />
  do let st = newStack (__FILE__ ++ ":" ++ (show __LINE__) ++ "(lexSourceStringWithExtA)")<br />
     a1p &lt;- fromNative (pushStack st (__FILE__ ++ ":" ++ (show __LINE__) ++ "(fromNative)")) a1<br />
     a2p &lt;- fromNative (pushStack st (__FILE__ ++ ":" ++ (show __LINE__) ++ "(fromNative)")) a2<br />
     res &lt;- lexSourceStringWithExt a1p a2p<br />
     toNative st res<br />

And the exact line is

<br />
a2p &lt;- fromNative (pushStack st (__FILE__ ++ ":" ++ (show __LINE__) ++ "(fromNative)")) a2<br />

This is interesting for a couple of reasons., The profiler is saying that the pointer associated with the CWString (which is defined as a Ptr CWchar) is never freed. But why not.

The answer lies in the C# Marshaller and types being used. We are currently Marshalling C# strings using the String datatype. Strings in C# are immutable, so once the marshaller creates a wchar_t* from the string, it never worries about it again. They are strictly an in parameter.

There are two ways to solve this:

  • C# does have mutable strings, using the StringBuffer type. Using StringBuffer has the benefit that it already is implemented as a char pointer. The marshaller simply passes the pointer to the Haskell function and upon. After the function returns and the GC determines that the StringBuffer is no longer in use, it should free the memory (at least in theory).
  • Make the library just free any CWString it dereferences.

For now I’ve chosen the second approach, for no other reason other than it requires the least amount of change in existing code. In the future I’ll adopt the approach that Hs2lib will free any arguments being passed to it. I don’t know if this is the convention usually used. If someone has something against this approach I would love to hear it.

Update : There’s somewhat of a big gotcha that I’ve recently discovered. We have to remember that the String type in .NET is immutable. So when the marshaller sends it to out Haskell code, the CWString we get there is a copy of the original. We have to free this. When GC is performed in C# it won’t affect the the CWString, which is a copy.

The problem however is that when we free it in the Haskell code we can’t use freeCWString. The pointer was not allocated with C (msvcrt.dll)’s alloc. There are three ways (that I know of) to solve this.

  • use char* in your C# code instead of String when calling a Haskell function. You then have the pointer to free when you call returns, or initialize the pointer using fixed.
  • import CoTaskMemFree in Haskell and free the pointer in Haskell
  • use StringBuilder instead of String. I’m not entirely sure about this one, but the idea is that since StringBuilder is implemented as a native pointer, the Marshaller just passes this pointer to your Haskell code (which can also update it btw). When GC is performed after the call returns, the StringBuilder should be freed.

I’ve once again updated the library to not free any pointers. This prevents a nasty heap corruption. To not get memory leaks in c# you are free to choose between solution 1 & 3 presented here.

Results

With this new code in place, I once again run the profiled lexer to generate a dump. This time when I analyze the result however I get

*** Program starting up…

*** Reading file ‘.\MemDumps\Memory.dump’…

*** Found 33027 record(s).

*** Analyzing [********************] 100.00%

*** Found 0 outstanding allocation(s).

Congratulations, No memory leak(s) detected.

*** Cleaning up….

And so the memory leaks are fixed. It’s worth noting that the analyzers can be quite slow. It uses a flat LinkedList like structure and lists to do the analysis. I will in future versions be replacing these with a Tree like structure and arrays respectively.

Optimizations


This last week I’ve been busy with a lot of bug fixes, stability enhancements and finishing half implemented features. One of the big problems that I had was that the function which, for all intended purposes is the core of Visual Haskell, the module discovery code was very very slow. On average it ran in 1.2secs and a stdDev of 0.1sec.

This might not seem all that bad at first glance, but consider this, every 500ms after your last key press, a call is made to this function to validate your changes. If the file had errors this would show up right away and you would be informed of type errors etc immediately, but when type checking actually succeeds, getting all the information we desire from a module takes a 1.2seconds on average as stated above. To the user this would total a 1.7second delay for any changes (at least for the average Haskell file).

This is absolutely too slow, as features get added, it’s increasingly important to get this part right. My first thought was to optimize my use of Lists. I made changes so that cons is used as much as possible instead of the concatenation operator ++ , since cons runs in constant time.

This shaved off about 0.1seconds on average. which Is not bad, but still not what I was hoping to gain. So the second thought was that the lists themselves was slow. I assumed this to be a reasonable explanation since a lot of list operations took place.

My second change was to add strictness annotation to the datatypes (they’re being send over FFI anyway, so they’ll always be evaluated at one point, might as well do it sooner rather than later) and changed from Lists to a Vector from the "vector” package on Hackage.

Unfortunately the change to Vectors has the opposite effect of what I wanted, (yes I did enable optimizations). Execution time now became on average 1.8secs and StdDev 0.3secs. Clearly not the right direction.

So I removed the Vectors and decided to run some profiling, the results were interesting and certainly not hat I was expecting:

    Sun Jul 11 20:13 2010 Time and Allocation Profiling Report  (Final)

       Main.exe +RTS -p -RTS

    total time  =        1.22 secs   (61 ticks @ 20 ms)
    total alloc = 262,102,440 bytes  (excludes profiling overheads)

COST CENTRE                           MODULE             %time %alloc

Typecheck-Rename                   HscMain                41.0    42.5
CAF:loadWithLogger_r8fG        VsxParser             37.7    15.2
SimplTopBinds                           SimplCore               9.8    14.7
Parser                                           HscMain                   3.3      7.6
Simplify                                         SimplCore               1.6      0.1
OccAnal                                        SimplCore               1.6       3.6
bin_tycldecls                                BinIface                    1.6      4.9
occAnalBind.scc                         OccurAnal                 1.6      0.4
getModInfo                                  VsxParser               1.6      3.2
CoreTidy                                       HscMain                   0.0      2.0
CorePrep                                     HscMain                    0.0      2.3
CAF                                               Packages                  0.0      1.5

According to these results only 1.6% was spend actually processing the file by my function, the rest were spend by the ghc api mostly in loading and type checking. To see how well this presents itself as we scale, I ran the getModInfo function 47 times. The results were:

Sun Jul 11 21:17 2010 Time and Allocation Profiling Report  (Final)

   Main.exe +RTS -p -RTS

total time  =      44.22 secs   (2211 ticks @ 20 ms)
total alloc = 12,456,963,764 bytes  (excludes profiling overheads)

But getModInfo now takes up 14.3% of the execution time, but the rest of time is still largely spend in the ghc api.

On every call GHC has to load the module and any interfaces for any imports that module uses. This is the slowest part, which is also I/O bound. So what if we can prevent this.

Session information is stored in a type called HscEnv , this can be read and set using the methods setSession and getSession respectively. By restoring this session every time we can prevent GHC from reloading things it doesn’t need to. Since we already know that in between calls only the head modules could have changed we can safely do this.

The next question is then, how do we preserve this value in between calls. Since the method always terminates and we want to be able to keep track of multiple HscEnv (one for every document currently open in the IDE)

This is where StablePtr comes in (thanks to lispy from #Haskell for the suggestion), it offers us an opaque reference to a Haskell value and since it has a Storable instance I can pass it to and from C#. The ideal solution.

There was only one problem, the api for StablePtr provided no mechanism to update, but there was one to dereference it. The solution is to store a mutable value inside the StablePtr then, in this case an IORef.

Take a look at this example:

module Main where

import Foreign.StablePtr
import Data.IORef

type Context a = StablePtr (IORef a)
type Env       = Context [Int]

initEnv :: IO Env
initEnv = newStablePtr =<< newIORef []

freeEnv :: Env -> IO ()
freeEnv = freeStablePtr

add :: Env -> Int -> IO ()
add env val
  = do env_value <- deRefStablePtr env
       modifyIORef env_value ((val:) $!)
 
sum’ :: Env -> IO Int
sum’ env
  = do env_value <- deRefStablePtr env
       current   <- readIORef env_value
       return $ sum current
      
main :: IO Int
main
= do env <- initEnv
      add env 1
      add env 1
      add env 1
      add env 1
      val <- sum’ env
      freeEnv env
      return val
      

This shows how we can pass a simple state (Env) around during different invocations. The idea is that, the calls to InitEnv, add, sum’ and freeEnv are done over FFI, which is why it’s important to have the value Storable and stable (as in the GC won’t touch it).

Using this same approach we can write a helper class for the GHC api:

module GhcSession where

import HscTypes
import Data.IORef
import Foreign.StablePtr

import GHC
import GHC.Paths ( libdir )

type Context      = StablePtr (IORef HscEnv)

createContext :: IO Context
createContext =
  runGhc (Just libdir) $
     do env <- getSession
        liftIO $ newStablePtr =<< newIORef env
       
freeContext :: Context -> IO ()
freeContext = freeStablePtr

updateContext :: Context -> HscEnv -> IO ()
updateContext env val
  = do env_value <- deRefStablePtr env
       writeIORef env_value $! val
       — modifyIORef env_value ((const val) $!)
      
readContext :: Context -> IO HscEnv
readContext = (readIORef =<<) . deRefStablePtr
      
pushSession :: GhcMonad m => Context -> m ()
pushSession = (setSession =<<) . liftIO . readContext

pullSession :: GhcMonad m => Context -> m ()
pullSession = (getSession >>=) . (liftIO .) . updateContext


The only thing left to do now is this call push- and pullSession in the getModInfo function to set and update the state. Having done so it was time to run benchmarking again. The results were impressive, a speedup of over 500%.

    Mon Jul 12 01:57 2010 Time and Allocation Profiling Report  (Final)

       Main.exe +RTS -p -RTS

    total time  =        8.54 secs   (427 ticks @ 20 ms)
    total alloc = 2,128,219,560 bytes  (excludes profiling overheads)

This means that any one invocation should run in ~0.18s which should be pretty much unnoticeable to an end user. The added bonus is also less memory usage, since the biggest structure is pretty much reused. Because of the timestamps, even if other modules changed in between two calls, only the changed ones will get reloaded.

File vs In-Memory buffer type checking


I’ve recently been looking into how to make the type checking part faster. The type checker part consists of two parts just like most of the code in Visual Haskell 2010, A Haskell side and a C# side.

This post is about optimizations on the C# side.

the setup currently is as follows:

Every 500ms after the user has finished typing, a call is made to typecheck() which does a few  things,

  • Finds the current module information (cached)
  • Generates a temporary file which has the same content of the In-Memory buffer
  • Makes a call to the Haskell world
  • Interprets the results

The part I thought I could optimize is that I didn’t want to have to write the buffer out to a file only to have GHC read it back in. Under normal circumstances the files will probably be in disk cache and not even written out to begin with, but we would still have to make a couple of kernel calls (about 6).

It’s not like the new approach wouldn’t have drawbacks, for one thing you’d have the serialization drawback, you suddenly have to serialize large strings from and to the Haskell world, but above that the GHC Api doesn’t even support type checking of In-Memory buffers.

So the first part is to edit the GHC Api and add this functionality.

Modifying GHC

I won’t explain this in detail, but I’ll just outline the “gist” of it.

Whenever you want to tell GHC want to inspect, It does so by inspecting all the “Targets” you’ve specified. An example of this would be

target <- guessTarget file Nothing
addTarget target

which means, we first ask it to guess what the string is (a module, or filename) and it’ll construct the appropriate Target for us. In order to support In-Memory buffers I added a new TargetId

| TargetVirtualFile StringBuffer FilePath (Maybe Phase)
  — ^ This entry loads the data from the provided buffer but acts like
  –   it was loaded from a file. The path is then used to inform GHC where
  –   to look for things like Interface files.
  –   This Target is useful when you want to prevent a client to write it’s
  –   in-memory buffer out to a file just to have GHC read it back in.

This takes the string buffer, and the original filename, the filename is only used to discover properties about the buffer (the most important of which is what type of input it is, hspp, hsc, hs or lhs)  and along with this a new function was create the facilitate the create of a virtual target.

— | Create a new virtual Target that will be used instead of reading the module from disk.
–   However object generation will be set to False. Since the File on disk would could
–   and is most likely not the same as the content passed to the function
virtualTarget :: GhcMonad m => StringBuffer -> FilePath -> m Target
virtualTarget content file
   = return (Target (TargetVirtualFile content file Nothing) False Nothing)

so for it’s all pretty straight forward, the rest I won’t explain since they have no bearing on how to use this new code, but what I’ve done was basically trace the workings of the load2 function, and where appropriate added some new code to instead of reading a file into a buffer, to just use the buffer passed on to virtualTarget.

The problem is, in runPhase a system process is called to deLit a Literate Haskell file which is a bit of a problem since it means that I would have to have the file on disk anyway. I decided not to worry about that for now but instead to focus on implementing the change for normal Haskell files first so I can run some benchmarking code.

Testing

Now for the actual testing

I created a new DLL file which contains the compiled code from two Haskell functions

getModInfo :: Bool -> String -> String -> String -> IO (ApiResults ModuleInfo)

and

getModStringInfo :: Bool -> String -> String -> String -> String -> IO (ApiResults ModuleInfo)

They both do the same amount of work, only the latter passes along as a target a VirtualTarget instead of a normal File target. But first it’s time to see if the changes actually did something.

This first test just asks for all the information it can get from a file named “VsxParser.hs”

Phyx@PHYX-PC /c/Users/Phyx/Documents/VisualHaskell2010/Parser
$ ghcii.sh VsxParser
GHCi, version 6.13.20100521: http://www.haskell.org/ghc/
Ok, modules loaded: VsxParser.
Prelude VsxParser> getModInfo True "VsxParser.hs" "VsxParser" ""
Success: ModuleInfo {functions = (70,[FunType {_Tspan = VsxParser.hs:256:1-8, _Tname = "showPpr’", _type = Just "Bool -> a -> String", _inline = (0,[])},FunType {_Tspan = VsxParser.hs:252:1-7, _Tname = "mkSized", _type = Just "[a] -> (Int,[a])", _inline = (0,[])},FunType {_Tspan = VsxParser.hs:244:1-17, _Tname = "configureDynFlags", _type = Just "DynFlags -> DynFlags", _inline = (0,[])},FunType {_Tspan = VsxParser.hs:237:1-19, _Tname = "createLocatedErrors", _type = Just "ErrMsg -> [ErrorMessage]", _inline = (0,[])},FunType {_Tspan = VsxParser.hs:230:1-13, _Tname = "processErrors", _type = Just "SourceError -> IO (ApiResults a)", _inline = (0,[])},FunType {_Tspan = VsxParser.hs:69:1-4, _Tname = "main", _type =
(content goes on and on and on)

the content will go on for many more pages so I won’t post that

now, We call getModStringInfo asking for information about the same file, but this time we pass along a much smaller and completely different buffer than the one of the file on disk. namely a module with just 1 function “foo = 5”

Prelude VsxParser> getModStringInfo True "module VsxParser where\nfoo = 5\n" "VsxParser.hs" "VsxParser" ""
Success: ModuleInfo {functions = (1,[FunType {_Tspan = VsxParser.hs:2:1-3, _Tname = "foo", _type = Just "Integer", _inline = (0,[])}]), imports = (1,[Import {_Ispan = Implicit import declaration, _Iname = "Prelude", _pkg = Nothing, _source= False, _qual = False, _as = Nothing, _hiding = (0,[])}]), types = (0,[]), warnings = (0,[])}

As can be seen it used the content of the buffer and not the file to perform the analysis. So far so good. The new virtualTarget seems to be working just fine. Now comes the part you’ve all been waiting for, the numbers!

Benchmarking

First the setup, The two methods above as already mentioned were compiled to a static DLL. The tests are written in C# and the full code for it is as follows (you can skip this if it doesn’t interest you). Also my laptop harddrive is just 5400rpm so please keep this in mind 🙂

 static void Main(string[] args)
        {
            Console.WriteLine("Running Benchmarks....");

            int length = 500;
            List<Double> stringB = new List<double>();
            List<Double> fileB = new List<double>();
            string content = File.ReadAllText("VsxParser.hs");

            Console.Write("Press [enter] to start In-Memory buffer test");
            Console.ReadLine();

            Console.WriteLine("Running String tests...");
            unsafe
            {
                for (int i = 0; i < length; i++)
                {
                    DateTime start = DateTime.Now;
                    WinDll.Parser.getModInfoByString(true, content, "VsxParser.hs", "VsxParser", "");
                    stringB.Add(DateTime.Now.Subtract(start).TotalMilliseconds);
                }
            }

            Console.Write("Press [enter] to start File based test");
            Console.ReadLine();

            Console.WriteLine("Running File tests...");
            unsafe
            {
                for (int i = 0; i < length; i++)
                {
                    DateTime start = DateTime.Now;
                    string path = Path.ChangeExtension(System.IO.Path.GetTempFileName(), Path.GetExtension("VsxParser.hs"));
                    File.WriteAllText(path, content);
                    WinDll.Parser.getModuleInfoByPath(true, "VsxParser.hs", "VsxParser", "");
                    File.Delete(path);
                    fileB.Add(DateTime.Now.Subtract(start).TotalMilliseconds);
                }
            }
            Console.WriteLine("Writing results...");

            StreamWriter fs1 = File.CreateText("stringB.csv");
            for (int i = 0; i < length; i++)
            {
                fs1.Write(stringB[i].ToString());
                if (i < length - 1)
                    fs1.Write(", ");
            }
            fs1.Write(fs1.NewLine);
            fs1.Close();

            fs1 = File.CreateText("fileB.csv");
            for (int i = 0; i < length; i++)
            {
                fs1.Write(fileB[i].ToString());
                if (i < length - 1)
                    fs1.Write(", ");
            }
            fs1.Write(fs1.NewLine);
            fs1.Close();

            Console.WriteLine("Done.");
        } 


Aside from this, I’ve also used the Windows performance monitor to monitor haddrive activity. Both methods are ran 500times and all the times are measured in the milliseconds range.

Results

first off, the intuition was right, Windows observed a 100% disk cache hit for the duration of the test. So the files were always in cache. So the expected difference shouldn’t be that big (or should it?)

  String buffer File Buffer
Overview Results_Normal_s1 Results_Normal_s2
Performance clustering Results_Normal_b1 Results_Normal_b2
Geometric mean 636.594594942071087ms 666.617770612978724ms
Variance 1436.0ms 1336.56ms
Mean Deviation 26.6618ms 27.1434ms

The two charts reveal that they both performed in about the same ranges on average with no real noticeable difference. You have to remember that these numbers are in milliseconds (ms). The difference in Geometric means is almost negligible 30.02317567090764ms

Results_Normal_merge

Viewing both charts together we see a significant overlap which means on average the one doesn’t perform all that better from the other on normal disk usage.

But what happens when we have abnormal disk usage? What if the drive was so busy that the disk cache starts missing. Would the File based approach still perform “good enough” ?

To simulate high disk usage I used a Microsoft tool called SQLIO, it’ official use is to find disk performance capacity, but it does so by stressing the drive, so it works fine for us. (get it at http://www.microsoft.com/downloads/details.aspx?displaylang=en&FamilyID=9a8b005b-84e4-4f24-8d65-cb53442d9e19)

This is ran from a batch file in two modes read and write for about 36sec per mode. which should cover the length of 1 test. The batch file used is

sqlio -kW -s10 -frandom -o8 -b8 -LS -Fparam.txt
sqlio -kW -s36 -frandom -o8 -b64 -LS -Fparam.txt
sqlio -kW -s36 -frandom -o8 -b128 -LS -Fparam.txt
sqlio -kW -s36 -frandom -o8 -b256 -LS -Fparam.txt

sqlio -kW -s36 -fsequential -o8 -b8 -LS -Fparam.txt
sqlio -kW -s36 -fsequential -o8 -b64 -LS -Fparam.txt
sqlio -kW -s36 -fsequential -o8 -b128 -LS -Fparam.txt
sqlio -kW -s36 -fsequential -o8 -b256 -LS -Fparam.txt

sqlio -kR -s36 -frandom -o8 -b8 -LS -Fparam.txt
sqlio -kR -s36 -frandom -o8 -b64 -LS -Fparam.txt
sqlio -kR -s36 -frandom -o8 -b128 -LS -Fparam.txt
sqlio -kR -s36 -frandom -o8 -b256 -LS -Fparam.txt

sqlio -kR -s36 -fsequential -o8 -b8 -LS -Fparam.txt
sqlio -kR -s36 -fsequential -o8 -b64 -LS -Fparam.txt
sqlio -kR -s36 -fsequential -o8 -b128 -LS -Fparam.txt
sqlio -kR -s36 -fsequential -o8 -b256 -LS -Fparam.txt

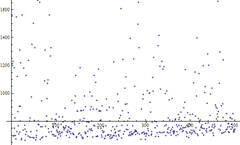
Running SQLIO and the benchmarks again the first thing that catches my eyes is that

disk cache performance has dropped from 100% to

95.4854

Looking at the dataset I see a lot of completely missed caches. Also remember that the SQLIO is also reading data,

so the disk cache activity also represents it’s reads and not just those of the benchmark as before. So let’s analyze the numbers like before

  String buffer File Buffer
Overview Results_Normal_s1x Results_Normal_s2x
Performance clustering Results_Normal_b1x Results_Normal_b2x
Geometric mean 883.339857882210200ms 904.505721026752581ms
Variance 2.26107*10^6ms 3.81543*10^6ms
Mean Deviation 449.206ms 611.77ms

These results are quite surprising since the difference in mean now is just 21.16586314454238ms. So under heavy load they start to converge to the same performance level.
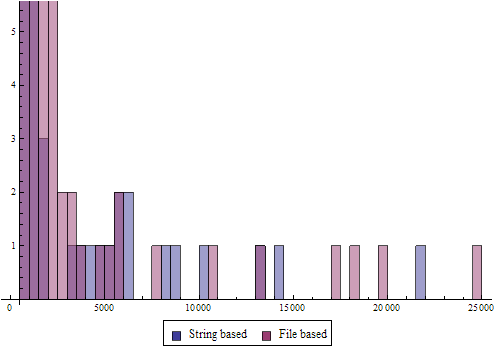
Results_Normal_mergex

So while both have some significant outliers,  both perform on average in the same category. It’s sad and hard to admit, but Unless I made a mistake when implementing the VirtualFile (which very well might be true) having a String vs File buffer doesn’t really make a big difference mostly due to the OS’s management of I/O and the disk caching going on.

In fact under heavy loads Windows started to use more and more “Fast Reads” and “Fast Writes” These require much less kernel and user mode calls than a full I/O call, so even that advantage was negated somewhat under heavy load, while the overhead of marshalling the string hasn’t changed, which might explain the smaller difference in Geometric mean in the second benchmark.

So the conclusion of the story is is, for now, there’s nothing to gain from the calls on the C# side, but maybe there is in the processing of the result but that’s saved for another time :). Up next, optimizing the Haskell Code to gather more complete module information and do it faster!.

Context sensitive lexing


This is something I haven’t seen in other Haskell IDEs before but which to me would be useful:

Context sensitive lexing, as in the lexer wil treat certain tokens differently based on information defined globally, e.g LANGUAGE Pragmas.

But first a quick recap of how lexing is done in visual haskell 2010:

  • The IDE will ask me to color text one line at a time
  • Everytime I want to color a line I make a call to HsLexer.dll which is a binding to the GHC Api, which calls the GHC lexer directly.
  • Multiline comments are handles in a local state and are never passed to the lexer because since I’m lexing one line at a time, I won’t be able to find the boundaries of the comment blocks like that, so instead I just keep track of the comment tokens {- and –} and identify blocks using a local algorithm that mimics the matching done by GHC.
    Using that I was always able to color GHC Pragmas a different color than normal comments, the reason for this is that they have special meaning, so I’m depicting them as such.

The original code for lexing on the Haskell side was

— @@ Export
— | perform lexical analysis on the input string.
lexSourceString :: String -> IO (StatelessParseResult [Located Token])
lexSourceString source = 
do
   buffer <- stringToStringBuffer source
   let srcLoc  = mkSrcLoc (mkFastString "internal:string") 1 1
   let dynFlag = defaultDynFlags
   let result  = lexTokenStream buffer srcLoc dynFlag
   return $ convert result

pretty straight forward, I won’t really be explaining what everything does here, but what’s important is that we need to somehow add the LANGUAGE pragma entries into the dynFlag value above.

To that end, I created a new function

— @@ Export
— | perform lexical analysis on the input string and taking in a list of extensions to use in a newline seperated format
lexSourceStringWithExt :: String -> String -> IO (StatelessParseResult [Located Token])
lexSourceStringWithExt source exts = 
do
   buffer <- stringToStringBuffer source
   let srcLoc  = mkSrcLoc (mkFastString "internal:string") 1 1
   let dynFlag = defaultDynFlags
   let flagx   = flags dynFlag
   let result  = lexTokenStream buffer srcLoc (dynFlag { flags = flagx ++ configureFlags (lines exts) })
   return $ convert result

which gets the list of Pragmas to enable in a newline \n delimited format. The reason for this is that WinDll currently does not support Lists marshalling properly. It’ll be there in the final version at which point I would have rewritten these parts as well. But until then this would suffice.

the function seen above

configureFlags :: [String] -> [DynFlag]

is used to convert from the list of strings to a list of recognized DynFlag that effect lexing.

Now on to the C# side, Information I already had was the location of the multi comment sections, so all I needed to do was, on any change filter out those sections which I already know to be a Pragma (I know this because I color them differently remember)

But since the code that tracks sections is generic I did not want to hardcode this, so instead I created the following event and abstract methods

public delegate void UpdateDirtySections(object sender, Entry[] sections);
public event UpdateDirtySections DirtyChange;

/// <summary>
/// Raise the dirty section events by filtering the list with dirty spans to reflect
/// only those spans that are not the DEFAULT span
/// </summary>
protected abstract void notifyDirty();

/// <summary>
/// A redirect code for raising the internal event
/// </summary>
/// <param name="list"></param>
internal void raiseNotifyDirty(Entry[] list)
{
    if (DirtyChange != null)
        DirtyChange(this, list);
}

and the specific implementation of  notifyDirty for the CommentTracker is

protected override void notifyDirty()
{
    Entry[] sections = (Entry[])list.Where(x => x.isClosed && !(x.tag is CommentTag)).ToArray();
    base.raiseNotifyDirty(sections);
}

Meaning we only want those entries that are Not the normal CommentTag and that are closed, i.e. having both the start and end values filled in. (the comment tracking algorithm tracks also unclosed comment blocks, It needs to in order to do proper matching as comments get broken or introduced)

The only thing left now is to make subscribe to this event from the Tagger that produces syntax highlighting and react to it. My specific implementation does two things, It keeps track of the current collection of pragmas and the previous collection.

then it makes a call to checkNewHLE to see whether we have introduces or removed a valid syntax pragma. If this is the case, it asks for the entire file to be re-colored.

This call to checkNewHLE is important, since when the user is modifying an already existing pragma tag,

for instance adding TypeFamilies  into the pragmas {-# LANGUAGE TemplateHaskell #-} we get notified for every keypress the user makes, but untill the whole keyword TypeFamilies has been types there’s no point in re-coloring the whole file.

The result of this can be seen below and I find it very cool to be frank 😀

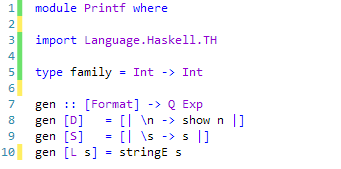
What it looks like with no pragmas

image

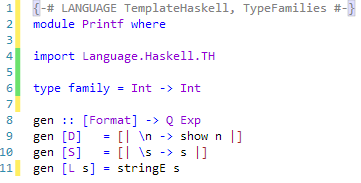
now look at what happens when we enable TemplateHaskell  and TypeFamilies

image

notice how with the extensions enabled “family” and “[|” , “|]” now behave like different keywords, this should be usefull to notify the programmer when he’s using certain features. For instance, with TypeFamilies enabled line 6 would no longer be valid because “family” is now a keyword.

GHC dll sizes


Just as a side note, for those who find the size of the shared libs generated from ghc to be very large strip and upx can do wonders.

strip -g -S –strip-unneeded -v HsLexer.dll

strips about 50% and

upx -9 -v HsLexer.dll

compresses another 80% bringing the size from HsLexer from 48mb to 4.8mb.

not bad, not bad indeed, and with virtually no overhead.

UPDATE: Corrected the numbers based on what Cippo mentioned. Thanks, Didn’t check them before posting